How Custom Metrics Work in Kubernetes
In Kubernetes, the Horizontal Pod Autoscaler (HPA) typically scales applications based on CPU or memory usage. However, many applications benefit from autoscaling on more specific metrics, like how many requests an API is handling or how long a message queue is growing. Custom metrics allow Kubernetes to perform more intelligent scaling based on these application-level insights.
How it works:
- Expose Custom Metrics from Applications:
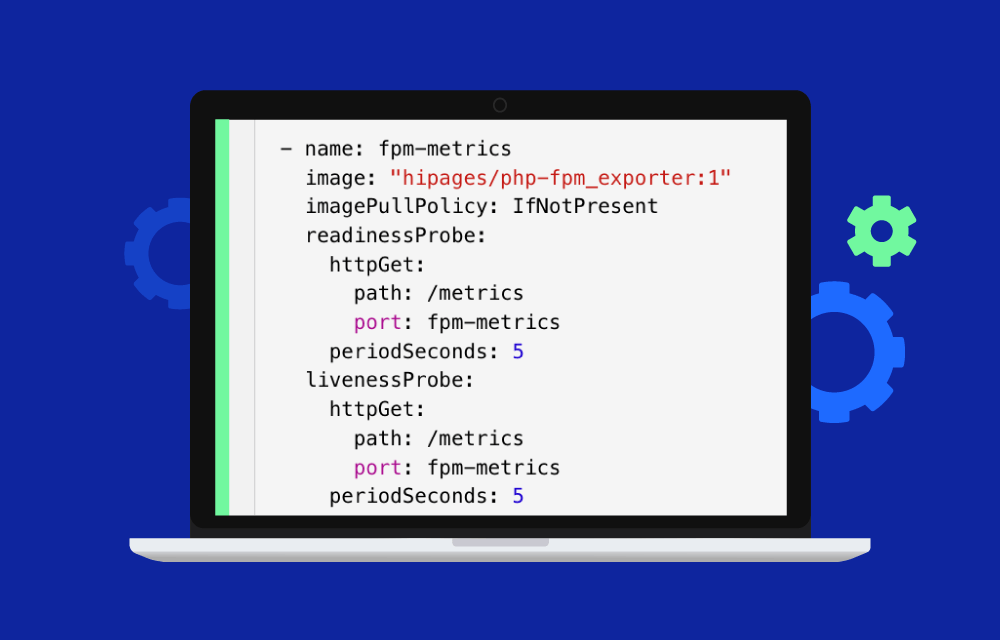
Applications or sidecar services (such as Prometheus exporters) expose custom metrics, such as request latency, error rates, or user activity, which are necessary for precise scaling decisions. - Collect Metrics via Monitoring Systems:
Systems like Prometheus scrape these custom metrics from your applications at regular intervals and store them for analysis. - Use a Metrics Adapter:
A custom metrics adapter (such as Prometheus Adapter) acts as a bridge between the metrics system and Kubernetes, making the custom metrics available through the Kubernetes Metrics API. - Horizontal Pod Autoscaler (HPA) Uses the Custom Metrics:
Once the custom metrics are available in Kubernetes, the HPA can use them to scale your pods. For example, if the average response time of your API exceeds a certain threshold, HPA can increase the number of pod replicas to handle the increased load.
Example of Using Custom Metrics
Let’s say you run an API service and want to scale based on the number of active requests. You would expose a custom metric called http_requests_per_second from your application. This metric is scraped by Prometheus and then made available to Kubernetes through the Prometheus Adapter. The Horizontal Pod Autoscaler (HPA) can now scale the number of pod replicas based on this metric.
  apiVersion: autoscaling/v2beta2
kind: HorizontalPodAutoscaler
metadata:
  name: api-hpa
spec:
  scaleTargetRef:
    apiVersion: apps/v1
    kind: Deployment
    name: api-deployment
  minReplicas: 2
  maxReplicas: 10
  metrics:
  - type: Pods
    pods:
      metric:
        name: http_requests_per_second
      target:
        type: AverageValue
        averageValue: 100
In this example, if the number of HTTP requests per second exceeds 100, the HPA will automatically add more pods to handle the additional traffic.
Advantages
- More Precise Autoscaling:
Allow scaling based on factors that are directly relevant to the workload. Instead of relying on CPU or memory as proxies for load, you can scale based on actual application demand, such as user traffic or system throughput. - Optimized Resource Allocation:
By scaling based on business-relevant metrics, Kubernetes ensures that pods are only added or removed when necessary, optimizing resource usage and minimizing costs. - Improved Performance:
Applications can respond more effectively to changes in demand, as autoscaling decisions are based on the real performance characteristics of the workload. This can prevent bottlenecks and improve overall system responsiveness.
Common Use Cases
- Scaling Web Applications:
Web services often scale based on HTTP request rates or response times. By using custom metrics likehttp_requests_per_secondoraverage_response_time, Kubernetes can add or remove pods to ensure the application remains responsive under heavy load. - Message Queue Processing:
For applications handling asynchronous tasks, such as message queues, scaling can be based on the length of the queue. For example, Kubernetes could add more pods to process messages faster if the queue length exceeds a certain threshold. - Scaling Based on Application Health:
In some cases, scaling might be triggered by metrics related to application health, such as error rates or failed transactions. If the number of errors exceeds a certain threshold, Kubernetes can scale up to handle the workload or trigger alerts for further investigation.
Tools for collecting custom metrics
- Prometheus:
Prometheus is a popular open-source monitoring system commonly used in Kubernetes environments. It scrapes custom metrics from applications, stores them, and provides querying capabilities. When combined with a Prometheus Adapter, it can expose these metrics to Kubernetes for use in autoscaling. - Prometheus Adapter:
The Prometheus Adapter is a bridge between Prometheus and Kubernetes, enabling the HPA to access custom metrics. It allows Kubernetes to use application-specific metrics for autoscaling decisions. - Metrics Server:
The Metrics Server in Kubernetes provides basic resource metrics (CPU and memory) but does not support custom metrics. Additional systems like Prometheus are required to collect, expose, and integrate these metrics into Kubernetes.
Challenges
- Setup Complexity:
Setting up custom metrics requires additional infrastructure, including configuring monitoring systems like Prometheus and ensuring that applications properly expose metrics. This adds a layer of complexity to Kubernetes management. - Overhead in Monitoring:
Collecting and monitoring large volumes of custom metrics can introduce overhead, both in terms of resource usage and management. It’s important to strike a balance between gathering the most relevant metrics and overloading the monitoring system. - Requires Fine-Tuning:
Defining the right custom metrics and thresholds for autoscaling requires careful planning and testing. Scaling based on incorrect or overly sensitive metrics can lead to unnecessary resource consumption or performance issues.


