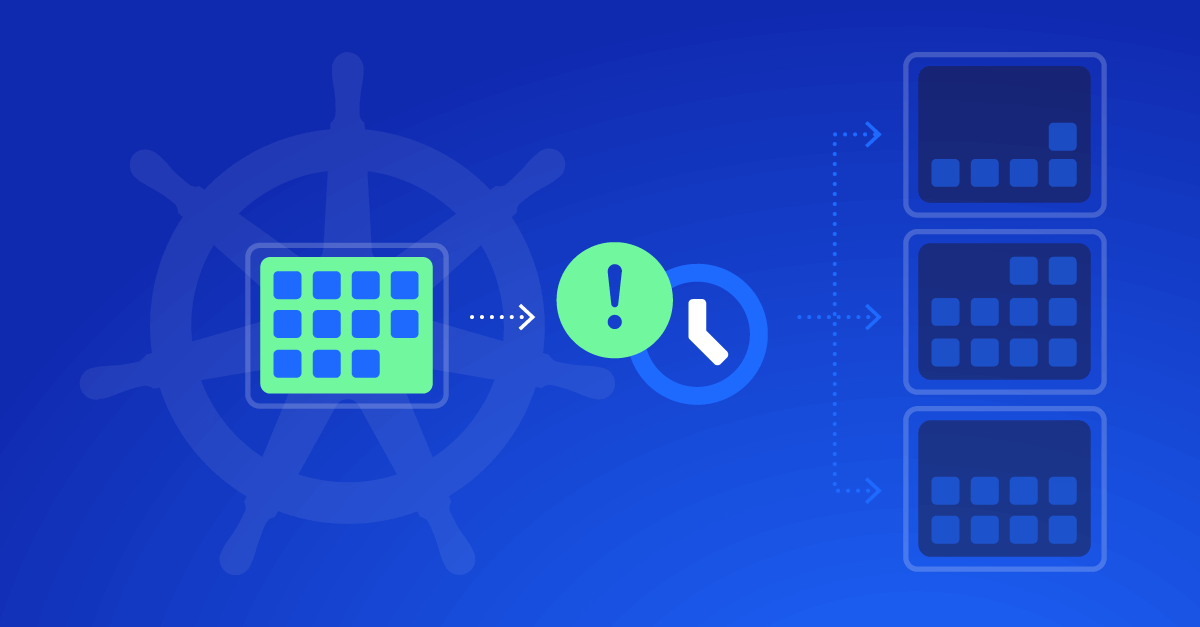

Load balancing is one of the most consequential decisions in your cluster. It directly affects CPU and memory utilization, HPA scaling decisions, and what you’re paying for at the end of the month.
And yet, it tends to be very low on most teams’ lists.
The factor most teams don’t account for is whether their load balancer understands what a request is. That distinction, surprisingly, lies in the difference between Layer 4 vs Layer 7 of your network stack.
Layer 4 vs Layer 7: What’s the difference?
How load balancing functions differently at each layer:
Layer 4 (transport layer) load balancing operates at the TCP/UDP connection level. It routes connections to backends without any awareness of what’s inside those connections. Kubernetes’ default kube-proxy implementation, whether using iptables or IPVS, operates at this layer. When a client opens a TCP connection to your Service, kube-proxy picks a pod and that connection goes there. Full stop.
Layer 7 (application layer) load balancing operates at the HTTP request level. It can inspect headers, paths, methods, and other application-level attributes before deciding where to send traffic. Ingress controllers (NGINX, Traefik, HAProxy, etc.) and service meshes (Istio, Linkerd, Cilium) operate here. Every individual HTTP request can be independently routed.
In Kubernetes terms:
| Component | Layer | Granularity |
| kube-proxy (iptables/IPVS) | L4 | Per connection |
| NodePort / ClusterIP Service | L4 | Per connection |
| Ingress controller | L7 | Per request |
| Service mesh sidecar proxy | L7 | Per request |
The granularity difference seems minor until you factor in how modern applications actually use connections, and that’s where things get interesting.
Up next: what happens when your application holds connections open, and why L4 load balancing turns that into a utilization problem.
Why some pods are drowning while others are idle
Here’s a scenario that plays out constantly in production Kubernetes environments.
You have a gRPC service with 5 replicas. gRPC uses HTTP/2, which multiplexes multiple requests over a single long-lived TCP connection. Your client-side load balancer establishes connections to a few pods at startup and reuses them. Pods 1 and 2 handle 80% of all requests. Pods 3, 4, and 5 handle the rest.
The root causes:
Long-lived connections stick to pods. HTTP/1.1 keep-alive, HTTP/2 multiplexing, database connection pools, WebSocket connections: all of these mean a single connection can carry thousands of requests to the same pod. L4 balancers balance connections, not requests. If connections are reused heavily, the connection distribution is a poor proxy for load distribution.
Connection establishment timing matters. Pods that come up first during a rollout attract more connections before other pods are ready. This early imbalance can persist for the entire lifetime of those connections.
Request processing time varies. Even with perfectly even request counts, pods that receive expensive requests will consume more CPU. L4 balancing has no way to account for this.
The result: your kubectl top pods output shows a cluster that looks fine on average, but individual pods tell a different story. This is hard to spot in dashboards that show service-level aggregates.
Checkpoint: Run kubectl top pods -l app=<your-service> and compare CPU/memory across replicas. A spread greater than 20-30% in CPU usage between pods of the same Deployment is a signal worth investigating.
Now that you can see the skew, let’s trace what it does to your autoscaler.
Why your HPA is scaling the wrong thing
Horizontal Pod Autoscaler works by comparing observed metric values against a target threshold and computing a desired replica count. The default calculation uses the average across all pods in the target Deployment:
desiredReplicas = ceil(currentReplicas * (currentMetricValue / desiredMetricValue))
Here’s the problem: averaging hides variance.
Suppose you have 5 pods. Your HPA target is 60% CPU utilization. The actual distribution looks like this:
| Pod | CPU Utilization |
| pod-1 | 92% |
| pod-2 | 88% |
| pod-3 | 45% |
| pod-4 | 40% |
| pod-5 | 35% |
| Average | 60% |
Average CPU is exactly at target. HPA sees no reason to scale. Meanwhile, pod-1 and pod-2 are saturated and latency is climbing.
Now flip the scenario: if pods 1 and 2 spike to 95%, the cluster average crosses the threshold and HPA scales up, adding replicas that will mostly sit underutilized because the underlying problem is distribution, not capacity. You’ve added cost without fixing the root cause.
This is especially pronounced with custom metrics. If you’re using Prometheus metrics fed through the Custom Metrics API or external metrics, aggregation functions in your PromQL queries (like avg()) compound the problem. Two overloaded pods get averaged with three idle ones, and the signal is lost.
Pitfall to avoid: Don’t tune your HPA target lower just to compensate for uneven distribution. That masks the real issue and leads to chronic overprovisioning. Fix the distribution first, then tune the target.
Next up: how this same problem propagates to VPA and locks in systematic overprovisioning at the resource request level.
Learn how Zesty adjusts pod resources across dynamic workloads automatically.
VPA is learning the wrong lessons
Vertical Pod Autoscaler observes pod resource usage over time and generates recommendations for CPU and memory requests and limits. It’s designed to rightsize pods based on actual observed behavior, a good idea in theory.
In practice, VPA’s recommendations are only as good as the signal it receives. When pod utilization is skewed, VPA observes the skew and recommends resources to accommodate it.
Here’s how that plays out:
- VPA watches your 5-pod Deployment over a rolling window (default: 8 days for the Auto mode, configurable via
--history-length). - It observes that pods 1 and 2 regularly peak at 900m CPU, while pods 3-5 rarely exceed 300m.
- To generate a recommendation that keeps all pods below their limits, VPA’s
Recommendercalculates percentile-based targets across the observed samples. - The recommendation comes back: 750m CPU request for all pods.
All five pods get upsized to accommodate the behavior of two overloaded pods. The three underutilized pods are now over-allocated by roughly 2.5x. Multiply that across dozens of workloads and you’re looking at significant wasted capacity that directly inflates your node count and cloud spend.
You can inspect current VPA recommendations with:
kubectl describe vpa <vpa-name> -n <namespace>
Look for the Recommendation section:
  Recommendation:

  Container Recommendations:

  - Container Name: app

    Lower Bound:

      cpu: 200m

      memory: 128Mi

    Target:

      cpu: 750m

      memory: 512Mi

    Upper Bound:

      cpu: 1200m

      memory: 768Mi
If the spread between Lower Bound and Upper Bound is very wide, that’s a sign VPA is seeing high variance, which is often a distribution problem, not a genuine capacity requirement.
Expected output: After improving load distribution, you should see VPA’s Target and Upper Bound converge closer together over the observation window.
The fix for all of this starts at the load balancing layer. Here’s what changes when you move to L7.
What actually changes with layer 7 load balancing
When your Ingress controller or service mesh proxy handles load balancing at the request level, the dynamics shift considerably.
Instead of distributing TCP connections at connection setup time, the proxy distributes individual HTTP requests as they arrive. This means:
More even utilization across replicas. Each request is independently routed to a pod using round-robin (or weighted, least-connections, etc. depending on your controller). Pods that finish processing requests quickly receive new ones sooner. No single pod accumulates a disproportionate share of work due to connection stickiness.
More consistent metric profiles. Because utilization is more evenly spread, the average CPU/memory metrics that HPA uses are a much more accurate representation of actual load. The gap between your highest and lowest loaded pods shrinks significantly.
Better bin packing. When VPA recommendations reflect genuine per-pod resource requirements (rather than requirements inflated by skew), resource requests are tighter. Tighter requests mean the Kubernetes scheduler can pack more pods per node, reducing total node count.
More predictable HPA behavior. With even utilization, HPA’s average-based scaling calculations align with reality. Scale-up events are triggered by genuine load increases, not by the tail of a skewed distribution.
To enable request-level load balancing in your cluster, you generally have two paths:
Option 1: Ingress controller with upstream load balancing. Most production-grade ingress controllers (NGINX Ingress, Traefik, HAProxy Ingress) load-balance HTTP requests across pod endpoints directly, bypassing kube-proxy for upstream traffic. The key capability to look for is endpoint awareness: the controller maintains its own list of pod IPs and routes requests to them individually, rather than forwarding to the Service ClusterIP and letting kube-proxy decide. Check your ingress controller’s documentation to confirm it operates in endpoint-aware mode and what load balancing algorithms it supports.
Option 2: Service mesh. Tools like Istio, Linkerd, or Cilium inject sidecar proxies (or use eBPF) to intercept all pod traffic and apply L7 policies including load balancing. This is more operationally complex but gives you the most control and visibility. Each mesh has its own way of configuring load balancing behavior, so check your mesh’s traffic management documentation for how to set balancing algorithms per service.
Before you assume L7 solves everything, there are some important caveats worth knowing.
When Layer 7 is not the full answer
L7 load balancing meaningfully improves distribution for most HTTP workloads. But it’s not a silver bullet, and being honest about its limits will save you from chasing the wrong fix.
Session affinity reintroduces skew. If your application requires sticky sessions (e.g., stateful connections, shopping cart state without a distributed cache), you’ll configure session affinity. Session affinity intentionally routes repeated requests from the same client to the same pod, which reintroduces the exact kind of stickiness that L7 helps avoid. If you need stickiness, externalize state instead.
Inherently uneven workloads won’t be “fixed” by the load balancer. If your workload includes requests with wildly different compute costs (e.g., a batch processing endpoint vs. a lightweight health check), even perfect request distribution can result in uneven utilization. In these cases, consider routing heavy requests to a dedicated Deployment rather than mixing them with lightweight traffic.
L7 proxies add latency and operational overhead. Sidecar-based service meshes add a network hop per request. In latency-sensitive environments, this can be a significant concern. For most workloads it’s sub-millisecond, but measure before committing. eBPF-based approaches (Cilium) reduce this overhead considerably.
Non-HTTP protocols don’t get L7 benefits. If you’re running raw TCP services, databases, or non-HTTP gRPC without an L7-capable proxy, per-request balancing isn’t available. Connection-aware load balancing strategies like least-connections (available in IPVS mode for kube-proxy) can partially mitigate skew. Check your cluster’s kube-proxy documentation for how to enable this, as the configuration varies between kubeadm-managed clusters and managed Kubernetes offerings like GKE, EKS, and AKS.
Understanding these limits sets realistic expectations. Now let’s look at what you can do today, regardless of where you are in adopting L7.
Steps to improve distribution right now
You don’t need to deploy a full service mesh to start improving load distribution. Here’s a prioritized checklist you can work through incrementally.
Step 1: Assess your current distribution
Before changing anything, establish a baseline.
  # Check per-pod CPU and memory utilization
kubectl top pods -l app=<your-service> --sort-by=cpu

# For more granularity, pull Prometheus data if available
# Example PromQL to see per-pod CPU utilization spread:
# max(rate(container_cpu_usage_seconds_total{pod=~"my-service-.*"}[5m])) by (pod)
# / avg(rate(container_cpu_usage_seconds_total{pod=~"my-service-.*"}[5m])) by (pod)
A ratio above 1.5x between max and min pod utilization warrants investigation.
Step 2: Check your Service and Ingress configuration
Determine whether your traffic goes through kube-proxy (L4) or an Ingress controller (L7).
  # List ingresses and their controllers

kubectl get ingress -A

# Check what's actually handling traffic for your service

kubectl describe svc <your-service>
If your service is only exposed via ClusterIP with no Ingress, all load balancing is happening at L4.
Step 3: Check for long-lived connections
Identify whether clients are reusing connections heavily.
  # On a running pod, check current connections
kubectl exec -it <pod-name> -- ss -s
A high number of ESTABLISHED connections relative to request rate is a signal of connection reuse. If you’re seeing this in a gRPC or HTTP/2 service, L7 load balancing or client-side load balancing is strongly advisable.
Step 4: Evaluate your ingress controller’s upstream routing strategy
If you’re already using an Ingress controller, verify it routes directly to pod endpoints rather than through the ClusterIP Service. This is the difference between request-level distribution and connection-level distribution.
How to check this depends on your controller. For ingress-nginx, look for the service-upstream setting in your controller ConfigMap. For other controllers (Traefik, HAProxy, NGINX’s own kubernetes-ingress), check your controller’s load balancing documentation specifically, as the terminology and configuration differ enough that a generic example would be misleading.
Step 5: Consider a service mesh for complex workloads
If you’re running multiple services with complex traffic patterns, a service mesh gives you per-request load balancing, retries, circuit breaking, and observability in one package. Linkerd has one of the lowest operational overhead profiles for teams getting started; Istio gives more control for teams with dedicated platform engineers.
Common pitfall: Don’t enable a service mesh on all services at once. Start with the highest-traffic, most cost-sensitive service and measure the impact before rolling out broadly.
Step 6: Revisit VPA and HPA configurations after improving distribution
Once distribution is more even, your HPA and VPA signals will be cleaner. Re-evaluate:
- HPA target thresholds (you may be able to raise them safely)
- VPA observation windows (shorter windows will reflect the new distribution faster)
- Resource request/limit values for pods that VPA has over-recommended
The next section pulls all of this together into a single framing that’s worth keeping in mind.
How Zesty handles this automatically
The challenge with fixing load distribution manually is that it’s a loop you have to keep closing. Distribution shifts, VPA observation windows lag, and overprovisioning creeps back in before anyone notices.
Zesty’s Pod Rightsizing engine continuously adjusts CPU and memory requests based on real-time pod-level utilization, rather than locking in recommendations from a fixed observation window. When distribution is uneven, it doesn’t average hot pods with idle ones and overprovision everything. When distribution improves, it picks up the new profile immediately, no manual re-evaluation required.
Distribution Quality Is a Cost Lever, Not Just a Performance Concern
The path from load balancing strategy to cloud spend is direct, but most teams don’t trace it explicitly. Here’s the chain:
Poor load distribution → uneven pod utilization → noisy HPA and VPA signals → inflated replica counts and resource requests → excess node capacity → higher infrastructure cost.
Improving distribution quality doesn’t require a ground-up infrastructure overhaul. Start with visibility (per-pod utilization metrics), identify whether your bottleneck is connection-level or request-level, and move up the stack from there.
If you take one thing from this: the next time your HPA is scaling unexpectedly or VPA is recommending more resources than you think you need, check the distribution before you add capacity. The problem might not be that you need more pods. It might be that the pods you have aren’t sharing the work.
Next steps and further reading:
- Kubernetes HPA documentation: particularly the section on scaling algorithms and stabilization windows
- Linkerd load balancing deep dive: explains EWMA load balancing and why round-robin falls short under variable request latency
- IPVS-based kube-proxy: if you’re not ready for a service mesh, IPVS with least-connections is a meaningful step up from iptables
- VPA documentation on recommendation modes: understanding Initial, Auto, and Off modes and their observation windows