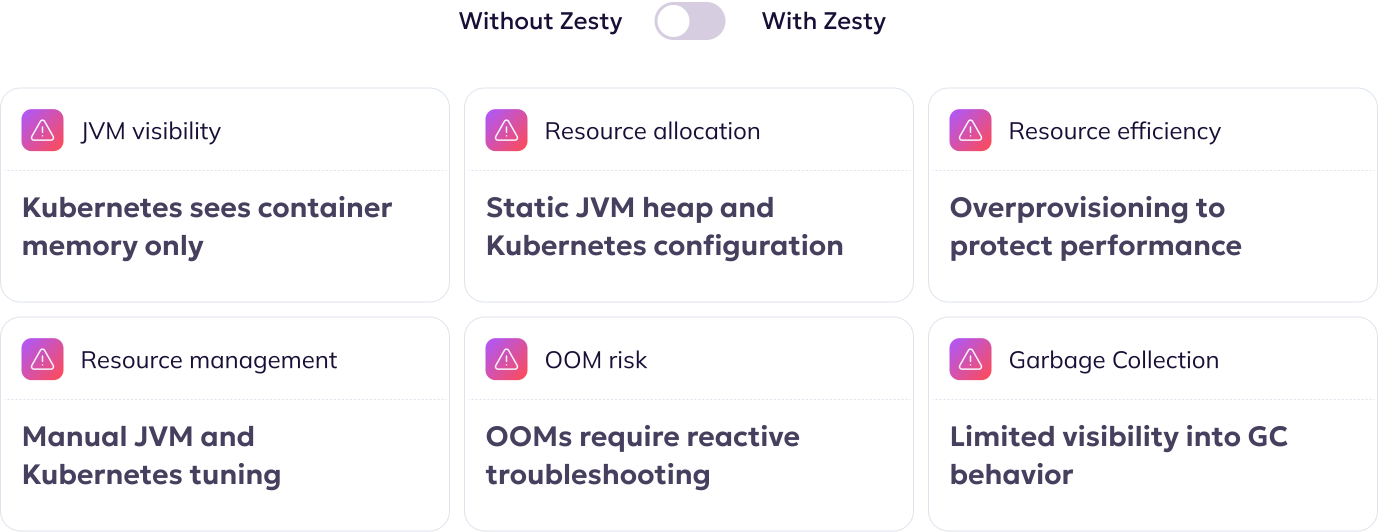
Zesty continuously analyzes JVM behavior and automatically rightsizes Java heap, pod CPU, and memory allocations based on real-time application demand. Reduce Java workloads costs and keep performance stable.
Go beyond container-level metrics. Zesty analyzes Java memory behavior, including heap and non-heap usage, garbage collection, memory pressure, and OOM signals.
Adjust Java heap size and pod CPU and memory requests in sync, based on in real time application demand and Garbage Collector behavior.
Replace static configurations and manual tuning with continuous, automated optimization that eliminates waste across your Java workloads.
Minimize overprovisioned Java memory and improve Kubernetes resource utilization.
Maintain the resources your Java applications need while reducing the risk of OOMs and throttling issues.
Spend less time configuring Java parameters, troubleshooting performance issues, and manually adjusting resources.
Optimize pod resources and replica counts to maximize performance and cost efficiency.
Automatically rightsize persistent volumes based on usage to reduce costs and maintain availability.
Automatically adjust GPU allocations to reduce stranded capacity and run more workloads on existing GPUs.
Continuously align commitments with usage to maximize coverage and minimize lock-in risk.
Reposition unevictable pods to reduce fragmentation and enable node consolidation.
Reduce app startup time by up to X5 to absorb spikes without throttling or OOMs.
Analyze workload costs, identify waste, and automate with clear data-driven insights.