User-friendly cloud cost reports for better decision making
As someone who has worked both as a cloud engineer and a FinOps professional, I understand the challenges of managing cloud budgets and the importance of making cost data accessible and actionable. Whether you’re part of a team or solely responsible for keeping the budget in check, creating user-friendly cloud cost reports and dashboards is essential. These tools not only provide visibility into spending but also foster a culture of responsibility and accountability within your organization. Here’s how you can achieve this.
Reporting and visualizing a company’s cloud spend are essential because it:
- Enhances visibility: It offers a clear view of cloud spending, helping teams understand where the money is going.
- Promotes accountability: By showcasing actionable insights, teams can take responsibility for their spending and make informed decisions to optimize costs.
- Encourage collaboration: When everyone has access to understandable and relevant data, it promotes a culture of collaboration towards cost-saving goals.
- Improve decision making: Actionable insights help teams prioritize their efforts, focusing on areas with the most significant impact on cost savings.
Best practices for creating user-friendly reports
- Focus on actionable insights
Your cloud cost reports should highlight data that teams can act upon. Avoid cluttering the dashboards with excessive information. Instead, prioritize metrics that provide clear, actionable insights.
Key metrics: Identify the most important metrics, such as total spend, cost by department, and trends over time. See more important KPIs to measure in this guide and decide on which ones match your business’ and the different teams’ objectives.
Alerts and notifications: Set up alerts for budget thresholds or unexpected spending spikes to prompt immediate action.
Recommendations: Include automated recommendations for cost optimization based on usage patterns. - Use intuitive visualizations
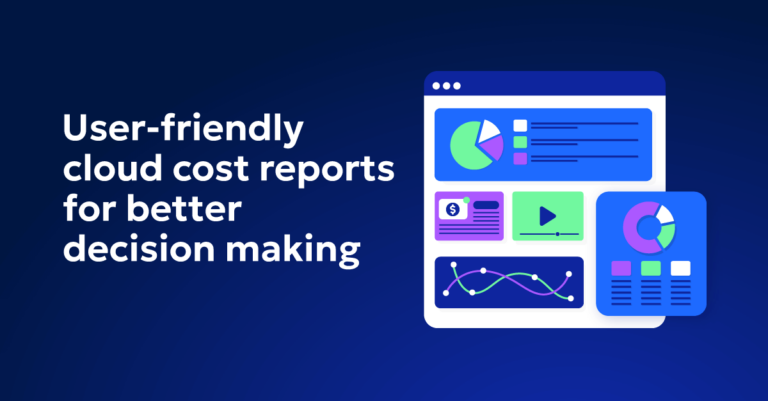
Visual representations of data can make complex information more understandable. Use charts, graphs, and color coding to highlight key trends and areas of concern.
Bar and line charts: Useful for showing trends over time.
Pie charts: Effective for visualizing the distribution of costs among different services or departments.
Heatmaps: Highlight areas of high and low spending. - Customize for different audiences
Different stakeholders have different needs. Customize cloud cost reports and dashboards to provide the most relevant information to each audience.
Executive dashboards: High-level summaries focusing on overall spending and trends.
Team dashboards: Detailed insights into specific areas of responsibility.
Individual reports: Personalized reports for resource owners highlighting their specific costs and usage. - Ensure accessibility
Make sure that reports and dashboards are easily accessible to all team members. Use a cloud-based platform that can be accessed from anywhere, and ensure that the interfaces are user-friendly also for team members that are not used to working with data visualization on a daily basis.
Cloud-based platforms: Tools like AWS Cost Explorer, Azure Cost Management, and Google Cloud’s Cost Management provide accessible platforms.
Mobile access: Ensure that reports and dashboards are mobile-friendly, allowing teams to access data on the go.
Recommended tools for user-friendly cloud cost reporting
- AWS cost explorer
AWS Cost Explorer provides detailed insights into your AWS spending, allowing you to visualize and analyze your costs. It offers customizable dashboards and reports that can be tailored to different stakeholders within your organization.
Features: Forecasting, trend analysis, and cost allocation by tags.
User-Friendly: Intuitive interface with customizable views.
- Azure cost management and billing
Azure Cost Management and Billing helps you monitor, allocate, and optimize your Azure spending. It provides detailed reports and dashboards that can be customized to highlight key metrics.
Features: Budget alerts, cost allocation, and recommendations.
User-Friendly: Interactive dashboards with clear visualizations.
- Google cloud’s cost management
Google Cloud’s Cost Management tools offer comprehensive insights into your cloud spending, with powerful dashboards and reporting features.
Features: Budget alerts, cost trends, and detailed usage reports.
User-Friendly: Clean and intuitive interface with easy-to-understand visualizations.
Implement a finOps culture in your organization
Creating intuitive reports that everyone can understand and drive actions from is just the first step. To foster a responsible FinOps culture, you need to ensure that these tools are used effectively. This you can do by carrying out following initiatives:
- Conduct regular training and workshops
Provide regular training sessions and workshops to help teams understand how to use the tools and interpret the data. This ensures everyone is on the same page and can use the insights to drive cost-saving initiatives.
- Set clear goals and KPIs
Define clear goals and key performance indicators (KPIs) related to cloud spending, set up alerts for negative trends, and define clear action items for the relevant teams . Use the dashboards to track progress and celebrate successes. This helps keep everyone motivated and focused on common objectives. - Encourage open communication
Promote open communication about cloud costs across the organization. Use regular meetings to review spending, discuss challenges, and brainstorm solutions. This approach helps identify issues early and fosters a collaborative environment. - Incentivize cost savings
Implement incentive programs to reward teams and individuals who achieve significant cost savings. Recognize their efforts publicly to encourage a culture of accountability and continuous improvement.
Empower your teams to make better decisions
Creating user-friendly cloud cost reports is essential for fostering a culture of responsibility and accountability within your organization. By focusing on actionable insights, using intuitive visualizations, and ensuring accessibility, you can empower your teams to take control of their cloud spending. Implementing these practices, along with the right tools and a supportive FinOps culture, will help you achieve your goal of lowering cloud costs and optimizing resource usage.
From my experience working from both sides of the table, I’ve seen firsthand how transformative these practices can be. By making data accessible and actionable, you can create a more transparent and accountable environment that drives better decisions when it comes to cut cloud costs and support your organization’s overall goals.


