Key Components
- Prometheus
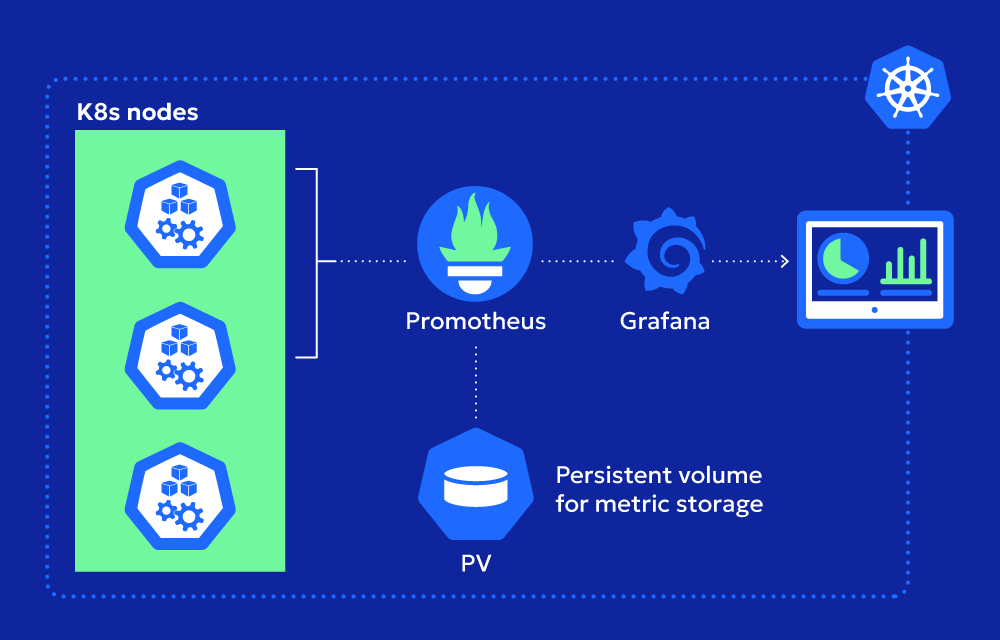
Prometheus is a time-series database that retrieves metrics from Kubernetes objects and applications. It scrapes data on a schedule, then stores these metrics so you can analyze both current and historical trends. - Alertmanager
When Prometheus detects an issue—like CPU usage exceeding a threshold—Alertmanager groups and routes these alerts. It can integrate with email, chat platforms, or ticketing systems to ensure the right people get notified. - Grafana
Grafana transforms raw metrics into dashboards and graphs. By default, Kube-Prometheus Stack provides prebuilt dashboards for cluster overviews, node performance, and pod usage, which can be further customized. - Exporters
Commonly included are kube-state-metrics (which focuses on resource states in Kubernetes) and node-exporter (which handles system-level metrics like CPU, memory, and disk usage).
Installation and Configuration
Deploying Kube-Prometheus Stack usually involves a single Helm command that sets up Prometheus, Alertmanager, Grafana, and their supporting components. You can override default settings—like storage class or retention time—by passing custom values in a YAML file. This approach lets you scale the stack to match the size and traffic of your Kubernetes environment.
After installation, Prometheus automatically discovers Services and Pods through Kubernetes labels and ServiceMonitor objects introduced by the Prometheus Operator. These monitors specify how and where Prometheus should fetch metrics. If you need additional metrics or custom monitoring rules, you can extend the stack with new alerts or dashboards.
Observability and Alerting
Once running, Kube-Prometheus Stack collects a broad set of metrics:
- Cluster Metrics: Overall health, pod restarts, resource consumption.
- Node Metrics: CPU load, memory utilization, disk I/O.
- Application Metrics: Response times, error rates, or custom counters from instrumented code.
Alerts fire when metrics breach predefined thresholds—for example, if a node’s CPU stays above 90% for five minutes. Alertmanager then sends notifications (emails, Slack messages, etc.) to specific recipients, grouping similar alerts to reduce duplication.
Use Cases
- Production-Ready Monitoring: Ideal for teams who want an out-of-the-box tool that requires minimal upfront setup.
- Scalable Observability: Accommodates high-volume clusters, thanks to Prometheus’ efficiency in handling large data sets.
- DevOps Integration: Offers quick visualization in Grafana and automated alerting for CI/CD pipelines.
Best Practices
- Storage Planning: Prometheus retains historical data, so make sure you have enough persistent storage, especially in larger clusters.
- Security: Configure authentication for Grafana and secure your endpoints to prevent unauthorized access.
- Fine-Tuned Alerts: Adjust alert thresholds to match your environment. Overly sensitive rules can cause alert fatigue.
In a Nutshell
Kube-Prometheus Stack provides a robust observability platform that bundles Prometheus, Alertmanager, Grafana, and supporting exporters into a single deployment. With its automated Service discovery, preconfigured dashboards, and flexible alerting, it’s a popular choice for teams seeking comprehensive insights into their Kubernetes environments.