Why KEDA is Different
KEDA (Kubernetes Event-Driven Autoscaler) gives you more control by letting you scale based on actual events — not just CPU or memory. You can scale workloads based on Redis, RabbitMQ, SQS, Azure Monitor, Prometheus, or even custom webhooks.
In this article, I’ll show you how to autoscale KEDA workloads from scratch, with working examples and practical notes on what to watch out for.
What KEDA Actually Does
KEDA is not a full replacement for HPA — instead, it acts as a metrics adapter and controller that connects external metrics to Kubernetes’ native scaling logic.
It does two main things:
- Launches a ScaledObject or ScaledJob resource that defines how and when to scale your deployment.
- Feeds real-time external metrics into HPA behind the scenes.
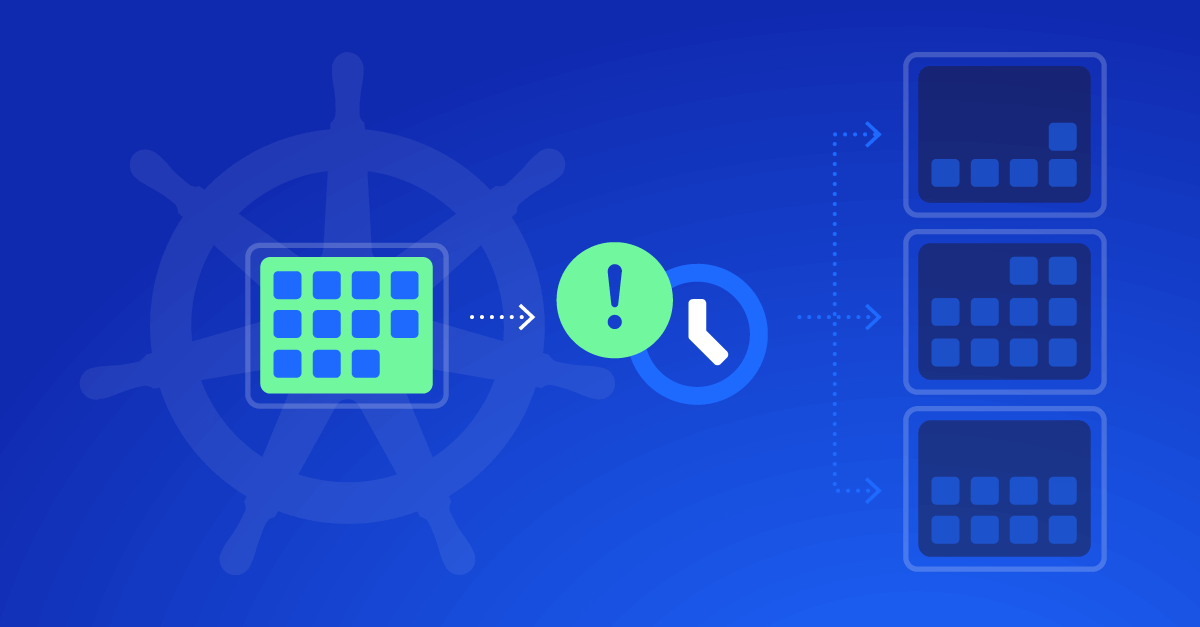
If the metric meets your scaling threshold, KEDA triggers pod scaling. If not, it keeps your deployment at zero (yes — you can scale to zero).
Core Components You’ll Work With
| Component | Description |
|---|---|
ScaledObject | Used for autoscaling Deployments or StatefulSets. |
ScaledJob | Used to run one-time or batch jobs based on a queue/event. |
Trigger | The source of events (Kafka, Prometheus, Azure Monitor, etc.). |
TriggerAuthentication | Secrets or credentials used to access the trigger source. |
KEDA Installation: Quick Start
Here’s how to install KEDA on your cluster:
  helm repo add kedacore https://kedacore.github.io/charts
helm repo update
helm install keda kedacore/keda --namespace keda --create-namespace
You should now see the keda-operator running in its namespace.
Example 1: Autoscaling a Deployment with Prometheus Metrics
Let’s say you want to autoscale based on a custom Prometheus metric, such as queue length.
Step 1: Create a Prometheus scaler config
  apiVersion: keda.sh/v1alpha1
kind: ScaledObject
metadata:
  name: my-worker-scaledobject
  namespace: default
spec:
  scaleTargetRef:
    name: my-worker-deployment
  pollingInterval: 15  # in seconds
  cooldownPeriod: 60   # how long to wait before scaling down
  minReplicaCount: 1
  maxReplicaCount: 10
  triggers:
    - type: prometheus
      metadata:
        serverAddress: http://prometheus-server.default.svc:9090
        metricName: queue_length
        threshold: '5'
        query: sum(my_app_queue_length)
The metric must return a numeric value. If it’s NaN or empty, KEDA won’t scale.
Example 2: Scaling to Zero with Kafka
This is where KEDA shines — let’s scale a consumer deployment to zero if the Kafka topic is empty.
  apiVersion: keda.sh/v1alpha1
kind: ScaledObject
metadata:
  name: kafka-consumer-scaledobject
spec:
  scaleTargetRef:
    name: kafka-consumer
  minReplicaCount: 0
  maxReplicaCount: 10
  triggers:
    - type: kafka
      metadata:
        bootstrapServers: my-kafka-broker:9092
        topic: my-topic
        consumerGroup: my-group
        lagThreshold: '5'
When to Use ScaledJob Instead of ScaledObject
Use ScaledJob if you want new pods per job, instead of long-running consumers. For example, pulling from a queue and processing items in parallel.
  apiVersion: keda.sh/v1alpha1
kind: ScaledJob
metadata:
  name: email-job
spec:
  jobTargetRef:
    template:
      spec:
        containers:
        - name: emailer
          image: my-email-sender:latest
        restartPolicy: Never
  pollingInterval: 10
  minReplicaCount: 0
  maxReplicaCount: 20
  triggers:
    - type: aws-sqs-queue
      metadata:
        queueURL: https://sqs.us-east-1.amazonaws.com/xxx/my-queue
        awsRegion: us-east-1
        queueLength: "10"
Common Mistakes to Avoid
| Mistake | Why it matters |
|---|---|
| Missing serviceAccount or role bindings | Many external triggers need access permissions (e.g. Prometheus, Kafka). |
| Using low polling intervals | Too frequent polling can overload your metric source. |
| Wrong metric format | If the Prometheus query doesn’t return a number, it breaks scaling. |
Not setting cooldownPeriod properly | You may get ping-pong scaling if it’s too short. |
Monitoring and Debugging
- Check KEDA metrics via:
kubectl get --raw /apis/external.metrics.k8s.io/v1beta1 | jq - Logs for troubleshooting:
bash CopyEdit kubectl logs -n keda deployment/keda-operator - Add the KEDA dashboard to Grafana using the official dashboard.
KEDA vs HPA vs VPA: When to Use What
| Feature | HPA | KEDA | VPA |
|---|---|---|---|
| CPU/Memory | ✅ | ✅ | ✅ |
| External events | ❌ | ✅ | ❌ |
| Scale to zero | ❌ | ✅ | ❌ |
| Container tuning | ❌ | ❌ | ✅ |
| Batch jobs | ❌ | ✅ (ScaledJob) | ❌ |
Wrapping Up: When KEDA is the Right Choice
KEDA is best when:
- You want to scale to zero and save costs.
- You’re using external event-driven systems (Kafka, SQS, Redis, etc.).
- You want to avoid writing custom controllers or external metric adapters.
It gives you fine-grained control with a Kubernetes-native feel.
FAQ
Can I use KEDA and HPA at the same time?
Yes, but they should not control the same deployment. Let KEDA manage one workload and HPA another — otherwise they’ll fight over replicas.
Can I use KEDA and HPA at the same time?
Yes, but they should not control the same deployment. Let KEDA manage one workload and HPA another — otherwise they’ll fight over replicas.
Does KEDA support custom metrics?
Yes, through Prometheus or external push-based webhooks.
What happens if the metric source is unreachable?
KEDA won’t scale. It needs valid metric values to take action.

