- Misconfigured resource requests and limits cost teams 30–50% of annual cloud spend. Overprovisioning hides waste in node fragmentation. Under-provisioning causes CPU throttling, OOM kills, and cascading failures.
- Set requests for p50–p75 usage; set limits for p95–p99 usage, always from 2–4 weeks of production data, never from dev environment metrics or intuition.
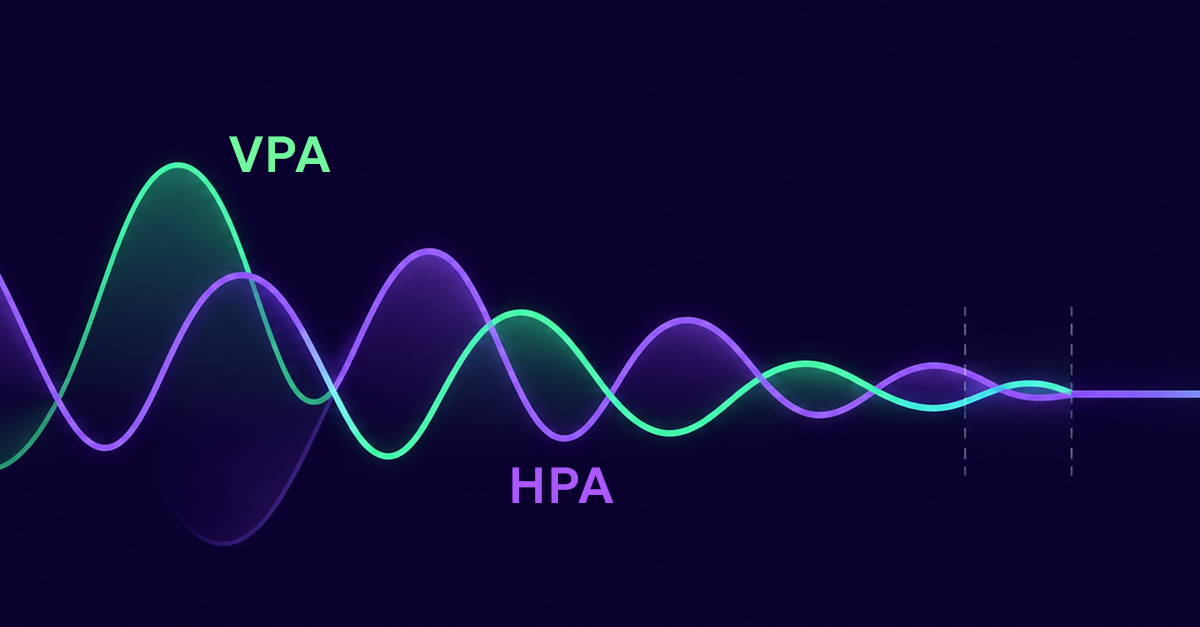
- VPA + HPA require guardrails: use queue depth or requests per second for HPA, never CPU utilization, to prevent the two autoscalers from oscillating against each other.
- Rightsize quarterly at minimum, monthly for active services, or skip the manual cycle entirely with Zesty, which continuously optimizes pod rightsizing, pod placement, and autoscaler coordination in real time.
Overprovisioned pods don’t just waste money. They hide waste inside node fragmentation and confuse your autoscalers. Under-provisioned pods are worse: CPU throttling degrades response times without warning, OOM kills restart your services mid-request, and cascading failures ripple through dependent workloads.
Between these two failure modes sits a narrow target: the right resource allocation for each workload. Finding it, and keeping it current as traffic patterns evolve, is what Kubernetes workload rightsizing is about.
This guide covers the core rightsizing techniques, a repeatable 4-step process, the VPA + HPA feedback loop problem and its fix, advanced patterns for bursty and stateful workloads, and when to automate instead of rightsize manually.
What Is Kubernetes Workload Rightsizing?
Kubernetes workload rightsizing is the process of matching each pod’s CPU and memory resource requests and limits to its actual runtime usage. Requests reflect normal operating conditions (p50–p75 of observed usage); limits reflect the peak ceiling (p95–p99). When those numbers drift from reality, set too high, too low, or never updated, you pay in wasted compute spend or degraded application performance.
The Overprovisioning Problem
Overprovisioning feels safe, but the downstream effects are significant:
Node fragmentation: Pods with inflated requests occupy scheduling slots without filling them. A node with 16 cores may only schedule a few pods, each reserving 4 cores but using 0.5, leaving remaining capacity unfillable and the node running at 15–20% actual utilization.
Autoscaler confusion: If your pod requests 4 cores but uses 0.5, utilization reads as 12.5%. HPA never triggers scale-out; VPA may recommend inflating requests further. Both tools optimize against the wrong baseline.
Scaling failures: When real traffic spikes, scale-out is delayed because utilization percentages were artificially suppressed. Fragmented nodes can’t consolidate, and your cluster adds nodes instead of using existing capacity.
The Underprovisioning Problem
CPU throttling: A pod that hits its CPU limit is throttled by the Linux cgroup even if the node has idle capacity, manifesting as increased latency, not errors.
OOM kills: When a pod exceeds its memory limit, the kernel sends SIGKILL. In-flight requests fail; dependent services time out.
Cascade failures: An OOM-killed database pod restarts into a burst of queued traffic it may not be provisioned to handle, triggering another OOM kill.
Overprovisioning vs. Underprovisioning: At a Glance
| Dimension | Overprovisioned | Underprovisioned |
| Cloud cost | High (wasted spend) | Appears low (until failures) |
| CPU utilization metric | Artificially low | Hits limit; throttled |
| Memory behavior | Reserved but unused | OOM kills on spike |
| Autoscaler accuracy | Confused; wrong decisions | HPA may not trigger in time |
| User impact | Indirect (wasted money) | Direct (latency, errors, restarts) |
| Visibility | Hard to detect | Easy to detect (OOM events) |
How to Rightsize Kubernetes Workloads
There are four core techniques. They work together; skipping one undermines the others.
1. Analyze Resource Usage
You can’t rightsize without data. Collecting 2–4 weeks of usage data, not a 24-hour snapshot, is the minimum baseline before changing any resource configuration. Measure CPU and memory at p50, p75, p90, and p99 percentiles across business-hours, off-hours, and at least one deployment event. Label workloads by team, service, cost-center, and environment before collecting, without attribution, you can’t act on the data.
| Tool | Granularity | Historical Data | Percentile Analysis | Best For |
| kubectl top | Pod/node, real-time only | No | No | Quick spot-checks; initial triage |
| Prometheus + Grafana | Pod/container, configurable | Yes (retention-dependent) | Yes (with PromQL) | Production baseline collection; custom dashboards |
| Datadog / New Relic | Pod/container, real-time + historical | Yes | Yes | Teams already on APM platforms |
| Zesty | Cluster-wide, continuous | Yes | Yes, automated | Automated rightsizing without manual analysis cycles |
Tools:
  # Basic usage visibility: pods

kubectl top pods --namespace=your-namespace

# Node-level usage

kubectl top nodes

# Sort by CPU consumption

kubectl top pods --namespace=your-namespace --sort-by=cpu
For production use, kubectl top is a starting point, not a monitoring strategy. Route metrics to Prometheus and visualize with Grafana dashboards showing p50, p75, p90, and p99 distributions over time, not just averages.
2. Set Resource Requests and Limits
Requests are the scheduler’s guarantee. A pod won’t be placed on a node that can’t satisfy its requests. Requests also determine the denominator in utilization calculations, which is why overprovisioned requests distort autoscaler behavior.
Limits are the kernel-enforced ceiling. CPU is throttled at the limit; memory causes OOM kills.
The rule of thumb:
- Requests = p50–p75 of observed CPU and memory usage
- Limits = p95–p99 of observed usage
Set requests for p50–p75 usage; set limits for p95–p99 usage. This single rule eliminates the two most common misconfigurations: requests set to peak (causing fragmentation) and limits set arbitrarily (causing OOM kills).
Example configuration:
  apiVersion: v1

kind: Pod

metadata:

  name: api-service

  labels:

    team: platform

    cost-center: infra

spec:

  containers:

  - name: api

    image: your-api:latest

    resources:

      requests:

        cpu: "500m"      # p75 of observed CPU usage

        memory: "512Mi"  # p75 of observed memory usage

      limits:

        cpu: "1500m"     # p99 of observed CPU usage

        memory: "1Gi"    # p99 of observed memory usage
Common mistakes to avoid:
| Mistake | Consequence |
| Setting requests = limits | Disables horizontal autoscaling; pod can never burst |
| Requests based on dev environment | Dev traffic is not prod traffic; always measure in prod |
| Setting limits without data | Arbitrary limits cause arbitrary OOM kills |
| Never updating after launch | Traffic patterns change; stale config accumulates waste |
3. Use Vertical Pod Autoscaler (VPA)
VPA automates the adjustment of CPU and memory requests and limits based on observed usage. It removes the manual feedback loop: instead of monitor → analyze → update YAML → deploy, VPA continuously updates recommendations.
VPA has three modes:
| Mode | What it does | When to use |
| Off | Collects data; no recommendations | Initial auditing |
| Recommendation | Generates recommendations; no changes | Production validation before automation |
| Auto | Updates pod resources; may restart pods | Non-critical workloads; batch jobs |
Basic VPA setup:
  apiVersion: autoscaling.k8s.io/v1

kind: VerticalPodAutoscaler

metadata:

  name: api-service-vpa

spec:

  targetRef:

    apiVersion: "apps/v1"

    kind: Deployment

    name: api-service

  updatePolicy:

    updateMode: "Recommendation"  # Start here; switch to Auto after validation

  resourcePolicy:

    containerPolicies:

    - containerName: api

      minAllowed:

        cpu: 100m

        memory: 128Mi

      maxAllowed:

        cpu: 4

        memory: 4Gi
The critical caveat: VPA and HPA with CPU-based metrics create feedback loops. See Section 4 for the detailed explanation and the guardrail that prevents it.
4. Use Horizontal Pod Autoscaler (HPA)
HPA scales replica count, not individual pod resources. It responds to load by adding or removing pods: automated pod scaling based on real-time demand signals.
Safe HPA configuration:
  apiVersion: autoscaling/v2

kind: HorizontalPodAutoscaler

metadata:

  name: api-service-hpa

spec:

  scaleTargetRef:

    apiVersion: apps/v1

    kind: Deployment

    name: api-service

  minReplicas: 2

  maxReplicas: 20

  metrics:

  - type: Pods

    pods:

      metric:

        name: http_requests_per_second  # Custom metric, not CPU %

      target:

        type: AverageValue

        averageValue: 100
The metric choice is critical. CPU utilization as the HPA trigger, when VPA is also active, creates oscillation. The safe alternative is custom metrics: requests per second, queue depth, or connection count. These reflect actual load without coupling to the resource allocation that VPA is simultaneously adjusting.
The 4-Step Rightsizing Process
Step 1: Monitor Resource Usage
Goal: Establish a real baseline across multiple traffic patterns.
- Deploy Prometheus + Grafana (or equivalent) to collect pod-level CPU and memory metrics
- Capture p50, p75, p90, p99 percentiles across a 2–4 week window, not a 24-hour snapshot
- Include peak hours, off-peak hours, and at least one deployment event
- Label pods by team, service, and cost-center before collecting data
What happens if data collection is incomplete? Rightsize conservatively (higher requests), then tighten incrementally. Never assume short-term averages represent production steady state.
Step 2: Identify Underutilized and Overutilized Workloads
Goal: Prioritize which workloads to change and how.
- Flag pods using less than 30% of requests (waste) or more than 80% of limits (risk)
- Prioritize OOM kill events first, CPU throttling events second
- Rank workloads by waste magnitude: wasted cores × hours = opportunity
- Identify seasonal outliers: workloads that behave differently on weekends or month-end
Output: A prioritized list with specific adjustment targets (e.g., “reduce api-service CPU requests from 2000m to 500m”).
What happens if Step 2 data is incomplete? Adjust aggressively toward your observed average, then tighten incrementally, never set requests below observed p50 without at least 4 weeks of data.
Step 3: Deploy Updated Requests and Limits
Goal: Apply changes safely, without incidents.
- Update resource requests and limits in YAML; commit to version control with documented rationale
- Run load tests in staging that simulate p99 peak traffic; validate no throttling or OOM events
- Canary rollout: apply to 10% of production replicas first; monitor for 24–48 hours
- If stable, roll out to 50%, then 100% over 2–5 days
- Keep previous configuration staged for one-command rollback
Team coordination: App owners know their workload’s traffic expectations better than the platform team. Involve them before making changes.
Step 4: Test and Tune
Goal: Validate under realistic load; iterate until stable.
- Run load tests at expected peak, p99 peak, and 2x peak
- Monitor for CPU throttling and OOM events; check latency against pre-change baseline
- If throttling: increase CPU limits by 20–30% and re-test; if OOM: increase memory limits to p99 + 20% buffer and re-test
- If stable: document final configuration; schedule next review
Cadence: Rightsize quarterly at minimum. Monthly is better. Trigger a re-review on major feature releases, significant traffic changes, or new infrastructure.
Benefits of Kubernetes Workload Rightsizing
Cost reduction is the most direct outcome: accurate requests improve bin-packing, reduce node fragmentation, and allow workloads to consolidate onto fewer nodes. Teams typically achieve 30–80% reduction in cloud spend on addressed workloads: a database pod downsized from 8 cores to 2 cuts that pod’s compute cost by 75%. Kubernetes cost optimization at the node level depends entirely on pod rightsizing being accurate first.
Performance improves because autoscalers make better decisions. HPA scales out before resource pressure causes degradation; VPA recommends limits that match actual peak usage. The result is reduced CPU throttling, fewer OOM kill restarts, and more predictable latency.
Operational stability follows: rightsized workloads generate fewer incidents. OOM kills stop paging on-call engineers. Throttling-related latency spikes stop triggering alerts. Less firefighting means more time spent on work that isn’t debugging whether a slowdown is traffic-driven or config-driven.
Key Challenges in Kubernetes Workload Rightsizing
Rightsizing is simple in principle but difficult to sustain at scale: six recurring obstacles explain why most clusters stay 30–50% overprovisioned even after teams attempt to address it.
| Challenge | Why It Matters | How to Address It |
| Inaccurate usage data | Short snapshots miss traffic cycles; rightsizing on bad data causes more problems than it solves | Collect 2–4 weeks minimum; use percentiles, not averages |
| Cost vs. performance tension | Tighter resources reduce cost but increase risk | Define SLA thresholds first; optimize within constraints |
| Dynamic workloads | Static requests/limits can’t adapt to 5–10x traffic variability | Use HPA for replica scaling + VPA in recommendation mode |
| VPA + HPA feedback loops | Both tools reacting to the same CPU signal create oscillation | Use non-CPU metrics for HPA (qps, queue length) |
| Manual overhead | The monitor → analyze → update → test → deploy cycle is expensive at scale | Automate with VPA or platform-level tooling |
| Team friction | DevOps owns costs; developers own workloads | Shared dashboards, FinOps culture, automated optimization |
The VPA + HPA Feedback Loop in Detail
This deserves specific attention because most documentation acknowledges the conflict without explaining the mechanism.
How the loop forms:
- VPA sets CPU requests for a pod to 500m based on recent usage
- Traffic spikes; CPU utilization climbs to 85% of the 500m request
- HPA, watching CPU utilization %, triggers scale-out: adds replicas
- More replicas = load distributed = lower CPU % per pod
- VPA observes lower CPU usage per pod; recommends reducing requests further
- Reduced requests = same load = higher utilization %
- HPA triggers scale-out again
The loop oscillates. Replica count and resource requests chase each other without converging.
The guardrail:
Configure HPA to watch custom metrics instead of CPU utilization:
  metrics:

- type: External

  external:

    metric:

      name: pubsub_subscription_num_undelivered_messages  # Queue depth

    target:

      type: AverageValue

      averageValue: 500
Queue depth, requests per second, or active connections reflect actual application load. They don’t respond to VPA’s resource adjustments. The two autoscalers operate on independent signals and don’t interfere.
VPA + HPA require guardrails: use queue length instead of CPU utilization metrics. This is the single configuration decision that prevents oscillation when both autoscalers are active.
Best Practices for Kubernetes Workload Rightsizing
1. Measure Before You Configure
- Deploy Prometheus + Grafana (or Zesty’s automated collection) and collect 2–4 weeks of p50/p75/p90/p99 data before touching any resource configuration
- Capture at least one peak traffic period, business-hours surge, month-end batch, or seasonal event
- Never use dev or staging metrics as a proxy for production usage
2. Review on a Schedule
- Run quarterly rightsizing reviews as a recurring calendar event; monthly for services with active development or variable traffic
- Trigger ad-hoc reviews within 48 hours of major releases, traffic changes, or infrastructure migrations
- Use VPA in Recommendation mode (or Zesty’s continuous recommendations) as an always-on signal between manual reviews
3. Coordinate with App Owners
- Brief service owners before changing resource requests and limits, ask about traffic spikes or batch patterns that won’t appear in your monitoring window
- Share utilization dashboards across DevOps and development teams; information asymmetry is the root cause of overprovisioning
- Use a shared FinOps dashboard (Zesty, Kubecost, or OpenCost) to make team-level waste visible and actionable
4. Automate Carefully
- Start VPA in Recommendation mode for 2–4 weeks; review suggestions before switching to Auto
- Never run VPA in Auto mode on stateful workloads, pod restarts risk data inconsistency
- For HPA, always use custom metrics (qps, queue depth) when VPA is also active
5. Tag for Accountability
- Apply team, service, cost-center, and environment labels to all workloads before collecting data, without attribution there’s no stakeholder ownership
- Run a monthly cost-by-team report; visibility alone changes behavior
yaml
  metadata:

  labels:

    team: payments

    service: checkout-api

    cost-center: CC-4421

    environment: production
6. Roll Out Gradually
- Canary: apply changes to 10% of replicas; monitor for 24–48 hours before proceeding
- Staged: roll to 50% after canary validation; full rollout over 3–5 days
- Keep previous configuration in version control for one-command rollback; use blue-green for stateful workloads
Real-World Trade-Offs and Advanced Patterns
Peak vs. Off-Peak Rightsizing
Scenario: An e-commerce platform runs 100 pods during business hours and 20 during off-hours. Traffic is 10x higher at 10am than at 2am.
Static approach: Set requests/limits for peak → waste 80% of compute during off-peak.
Better approach: Set requests/limits for the average steady-state workload (the pod’s per-replica behavior when load is distributed across 20–100 replicas). Let HPA handle the replica count as traffic rises and falls.
The pod’s per-replica resource usage doesn’t change 10x between peak and off-peak. The number of pods does. HPA handles the scaling; requests/limits handle the per-pod efficiency.
What happens if you set requests for peak and forget HPA? You pay for 100 replicas around the clock, running at 10–15% utilization overnight, with node fragmentation blocking consolidation.
Rightsizing Bursty Workloads
Scenario: A batch processing service is mostly idle but spikes hard for 30–60 seconds when a job triggers.
Challenge: If requests reflect the spike, you waste compute 95% of the time. If requests reflect the idle state, the pod may be throttled during the spike.
Approach:
- Set requests = baseline usage (idle state)
- Set limits = spike usage + 20% buffer
- Use VPA in recommendation mode to track the spike’s p99 magnitude over time
  resources:

  requests:

    cpu: "100m"      # baseline idle usage

    memory: "256Mi"

  limits:

    cpu: "2000m"     # spike p99 + 20% buffer

    memory: "1Gi"
What happens if limits are set too close to the spike ceiling? The pod is CPU-throttled or OOM-killed mid-job, the job restarts from scratch, and any timeout in the pipeline fails.
VPA + HPA Without Feedback Loops
| Component | Metric | Why |
| VPA | Actual CPU/memory usage | Adjusts per-pod resource configuration based on observed consumption |
| HPA | Requests per second or queue depth | Scales replica count based on application load, not utilization % |
With signal separation, VPA updates pod resources and HPA scales replicas independently. No oscillation.
What happens if you skip signal separation? VPA and HPA chase each other’s adjustments, replica counts and resource requests oscillate without converging, producing scaling thrash visible in HPA events within the same hour.
Monitor for scaling thrash: if replica counts or resource configs are changing faster than your traffic patterns warrant, the signals are interfering. Adjust the HPA metric target or add cooldown periods.
Cost-Driven vs. Performance-Driven Rightsizing
These are not the same target and should not be optimized simultaneously without a clear priority:
| Approach | Requests | Limits | Risk | When to use |
| Cost-driven | p50 usage | p90 usage | Higher throttling risk | Batch jobs, dev environments |
| Balanced | p75 usage | p99 usage | Low | Most production services |
| Performance-driven | p90 usage | p99 + buffer | Higher cost | SLA-critical services |
Define your SLA first. If your SLA requires p99 latency ≤ 100ms, calculate the resource floor that achieves that, and don’t rightsize below it, regardless of cost pressure.
What happens if you rightsize for cost without checking SLA thresholds? Throttling increases incrementally under load, p99 latency drifts past your SLA ceiling over weeks, and by the time the breach is caught, multiple changes have contributed, making root cause unclear.
Stateful Workloads (Databases, Caches)
Stateful pods, databases, caches, message brokers, require conservative rightsizing. They can’t be evicted and rescheduled without risk of data loss or service disruption.
Approach:
- Requests = p90 of observed usage (leave headroom)
- Limits = peak observed usage + 20% buffer
- VPA: Recommendation mode only; never Auto for stateful workloads
- Monitor throttling proactively; increase limits before the workload hits them, not after
yaml
  resources:

  requests:

    cpu: "2000m"     # p90 of observed usage

    memory: "8Gi"

  limits:

    cpu: "4000m"     # peak + 20%

    memory: "12Gi"
What happens if a stateful pod is OOM-killed? In-flight transactions fail, WAL replay or cache warmup adds minutes before the pod is usable, and every downstream service that was waiting cascades into timeout failures.
Rightsizing at Scale: When the Manual Process Stops Scaling
The 4-Step Process: Recap
Kubernetes workload rightsizing is not a one-time project.
- Monitor for 2–4 weeks, identify over- and underprovisioned workloads against utilization thresholds, deploy changes via canary rollout, then test and tune until stable.
- Rightsize quarterly at minimum; monthly is better. Traffic patterns change with every feature release, seasonal event, and infrastructure migration. A configuration that was accurate six months ago accumulates drift.
This process works, but it requires:
- Continuous monitoring: weeks of baseline data collection, maintained across every workload
- Quarterly reviews: manual analysis of utilization trends, team by team, service by service
- Cross-team coordination: DevOps updates YAML; app owners validate; SREs sign off
- Ongoing testing: staging load tests, canary rollouts, production validation
At small scale, this is manageable. At 50, 200, or 500 workloads, the manual cycle becomes a full-time job: one that still produces a quarterly snapshot of a continuously changing system.
This is where Zesty’s Kubernetes Optimization Platform operates.
Zesty continuously monitors real-time resource usage across your cluster, with no manual data collection and no quarterly snapshots. It identifies over- and underprovisioned workloads automatically, adjusts pod rightsizing in real time, and consolidates workloads through intelligent pod placement. The feedback loop between VPA and HPA that requires careful manual guardrails is handled natively: Zesty’s multi-dimensional autoscaling (MDA) separates vertical and horizontal scaling signals to prevent oscillation.
Why Zesty works:
- Real-time optimization (not quarterly): Zesty continuously adjusts resource requests and limits as traffic patterns change, not once every 90 days
- Intelligent pod placement (not just rightsizing): beyond pod rightsizing, Zesty consolidates workloads onto fewer nodes, reducing cluster size directly
- Unified platform (combines VPA + HPA + node optimization): a single layer that coordinates vertical scaling, horizontal scaling, and node-level consolidation without the manual guardrails each tool normally requires
- Prevents feedback loops: smart guardrails between horizontal and vertical scaling signals prevent the VPA + HPA oscillation that manual configurations need to avoid explicitly
Teams using Zesty achieve 30–60% cost reduction platform-wide, not by running a manual rightsizing cycle once a quarter, but by continuously optimizing a living system that changes every time a new service deploys, traffic spikes, or a workload pattern shifts.
What you’ve learned in this guide, the 4-step process, the VPA + HPA guardrails, and the percentile-based request/limit targets, is what Zesty automates.
Get Started
Run your first rightsizing audit with kubectl top pods --all-namespaces --sort-by=cpu to identify your highest-consuming workloads. Collect 2–4 weeks of Prometheus metrics. Start with your three most expensive services.
Or skip the manual cycle entirely: See how Zesty achieves 30–60% cluster cost reduction, without quarterly reviews, YAML updates, or staged rollouts managed by hand.
FAQ
How often should I rightsize Kubernetes workloads?
Quarterly at minimum, monthly for services with active development or variable traffic. Trigger an ad-hoc review within 48 hours of a major release, a traffic pattern change, or an infrastructure migration rather than waiting for the next scheduled cycle.
What is the difference between requests and limits?
Requests are the scheduler’s guarantee and determine where a pod can be placed; limits are the kernel-enforced ceiling that triggers CPU throttling or an OOM kill. Set requests for p50 to p75 of observed usage and limits for p95 to p99.
Why do VPA and HPA conflict with each other?
Both tools react to the same CPU signal by default, so an adjustment from one changes the input the other is watching, producing oscillation instead of a stable configuration. Configuring HPA to scale on queue depth or requests per second instead of CPU utilization removes the shared signal and stops the loop.
Can rightsizing cause an outage if I get it wrong?
It can if changes are pushed directly to 100% of replicas without validation. A canary rollout to 10% of replicas, monitored for 24 to 48 hours before a staged rollout to 50% and then 100%, keeps a bad configuration change contained to a small slice of traffic instead of the whole service.
Do I have to run the 4-step process manually every quarter?
Not if the operational overhead of manual monitoring, analysis, and staged rollout has become the bottleneck. Zesty’s Multi-Dimensional Autoscaling (MDA) continuously applies the same percentile-based logic this guide walks through, and separates the vertical and horizontal scaling signals so VPA and HPA don’t fight each other, without a quarterly manual cycle.